PixelLight profiling system. More...
#include <Profiling.h>
Public Member Functions | |
| bool | IsActive () const |
| Returns whether the profiling system is active or not. | |
| void | SetActive (bool bActive=false) |
| Sets whether the profiling system is active or not. | |
| String | GetSelectedGroup () const |
| Returns the name of the current selected profile group. | |
| PLCORE_API bool | SelectGroup (const String &sName="") |
| Selects a profile group. | |
| PLCORE_API String | SelectNextGroup () |
| Selects the next profile group. | |
| PLCORE_API String | SelectPreviousGroup () |
| Selects the previous profile group. | |
| PLCORE_API bool | Set (const String &sGroup, const String &sElement, const String &sText) |
| Sets the element text. | |
| PLCORE_API String | GetText (const String &sGroup, const String &sElement) const |
| Returns the element text. | |
Static Public Member Functions | |
| static PLCORE_API Profiling * | GetInstance () |
| static PLCORE_API bool | HasInstance () |
Detailed Description
PixelLight profiling system.
- Remarks:
- The PL API profiling tool is extreme useful to acquire information about certain code parts and their performance. If the profiling is activated with Profiling::GetInstance()->SetActive() it displays you information like current FPS, triangle count, number of scene nodes, scene update time etc. With this information you are able to find out were your performance is burned. The profiling information are subdivided in groups like general, scene, textures etc. containing elements were you could �browse� through using offered functions like Profiling::GetInstance()->SelectNextGroup(). By default the PL console offers all required commands to handle the profiling tool in a comfortable way therefore there�s no real need to use the profiling browse functions offered by the profiling interface. :)
Adding own groups and elements:
The profiling information could be expand with own information you maybe want to add to inspect the runtime behavior of certain codes. In fact that�s much easier as it may sound first... in real it�s only ONE function called Profiling::GetInstance()->Set() you need to use to customize the PL profiling tool!!
Example:
// Add profiling information
Profiling::GetInstance()->Set("MyProfilingGroup", "Name: " + sName);
Profiling::GetInstance()->Set("MyProfilingGroup", String("Current level: ") + nLevel);
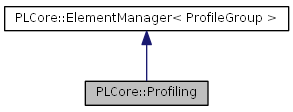
This will add the defined elements to the own profiling group �MyProfilingGroup�. If this group doesn�t exist yet it�s created automatically, therefore you done have to be interested in the stuff behind all! If you want to do more that only the described above it�s still possible because you have FULL access to all required to remove groups etc. (because the profiling class is derived from ElementManager)
- Note:
- You can manipulate each element by hand, but it's recommended to use the helper functions provided by the profiling system
Member Function Documentation
| static PLCORE_API Profiling* PLCore::Profiling::GetInstance | ( | ) | [static] |
| static PLCORE_API bool PLCore::Profiling::HasInstance | ( | ) | [static] |
| bool PLCore::Profiling::IsActive | ( | ) | const [inline] |
Returns whether the profiling system is active or not.
- Returns:
- 'true' if the profiling system is active, else 'false'
- Note:
- If the profiling system is active the current profile group information will be shown automatically
| void PLCore::Profiling::SetActive | ( | bool | bActive = false | ) | [inline] |
Sets whether the profiling system is active or not.
- Parameters:
-
[in] bActive Should the profiling system be active?
| String PLCore::Profiling::GetSelectedGroup | ( | ) | const [inline] |
Returns the name of the current selected profile group.
- Returns:
- Name of the current selected profile group
| PLCORE_API bool PLCore::Profiling::SelectGroup | ( | const String & | sName = "" | ) |
Selects a profile group.
- Parameters:
-
[in] sName Name of the profile group which should be the current one If "" general profile information are shown.
- Returns:
- 'true' if all went fine, else 'false' (maybe there's no group with this name??)
| PLCORE_API String PLCore::Profiling::SelectNextGroup | ( | ) |
Selects the next profile group.
- Returns:
- Name of the current selected profile group
| PLCORE_API String PLCore::Profiling::SelectPreviousGroup | ( | ) |
Selects the previous profile group.
- Returns:
- Name of the current selected profile group
| PLCORE_API bool PLCore::Profiling::Set | ( | const String & | sGroup, |
| const String & | sElement, | ||
| const String & | sText | ||
| ) |
Sets the element text.
- Parameters:
-
[in] sGroup Group name [in] sElement Element name [in] sText Text to be set
- Returns:
- 'true' if all went fine, else 'false' (maybe the profiling is deactivated??)
- Note:
- The group/element is created automatically
- If the profiling system is currently deactivated this function makes nothing
| PLCORE_API String PLCore::Profiling::GetText | ( | const String & | sGroup, |
| const String & | sElement | ||
| ) | const |
Returns the element text.
- Parameters:
-
[in] sGroup Group name [in] sElement Element name
- Returns:
- The text of the element, empty if there was an error
The documentation for this class was generated from the following files:

